Read a broadcast report
Every broadcast has a report. It shows how many emails were delivered, who opened and clicked once machine activity is filtered out, what bounced and why, and which links people used. It fills in while the broadcast sends and settles in the hour or so after.
Before you begin#
- The report has numbers once a broadcast starts sending. For a draft or scheduled broadcast, the same page shows a countdown and a Pre-flight checklist instead.
- Opens and clicks need a live tracking domain. See Set up your tracking domain.
Open a report#
- In the main sidebar, click Broadcasts.
- Click the broadcast’s row, or choose View details from its ⋯ menu.
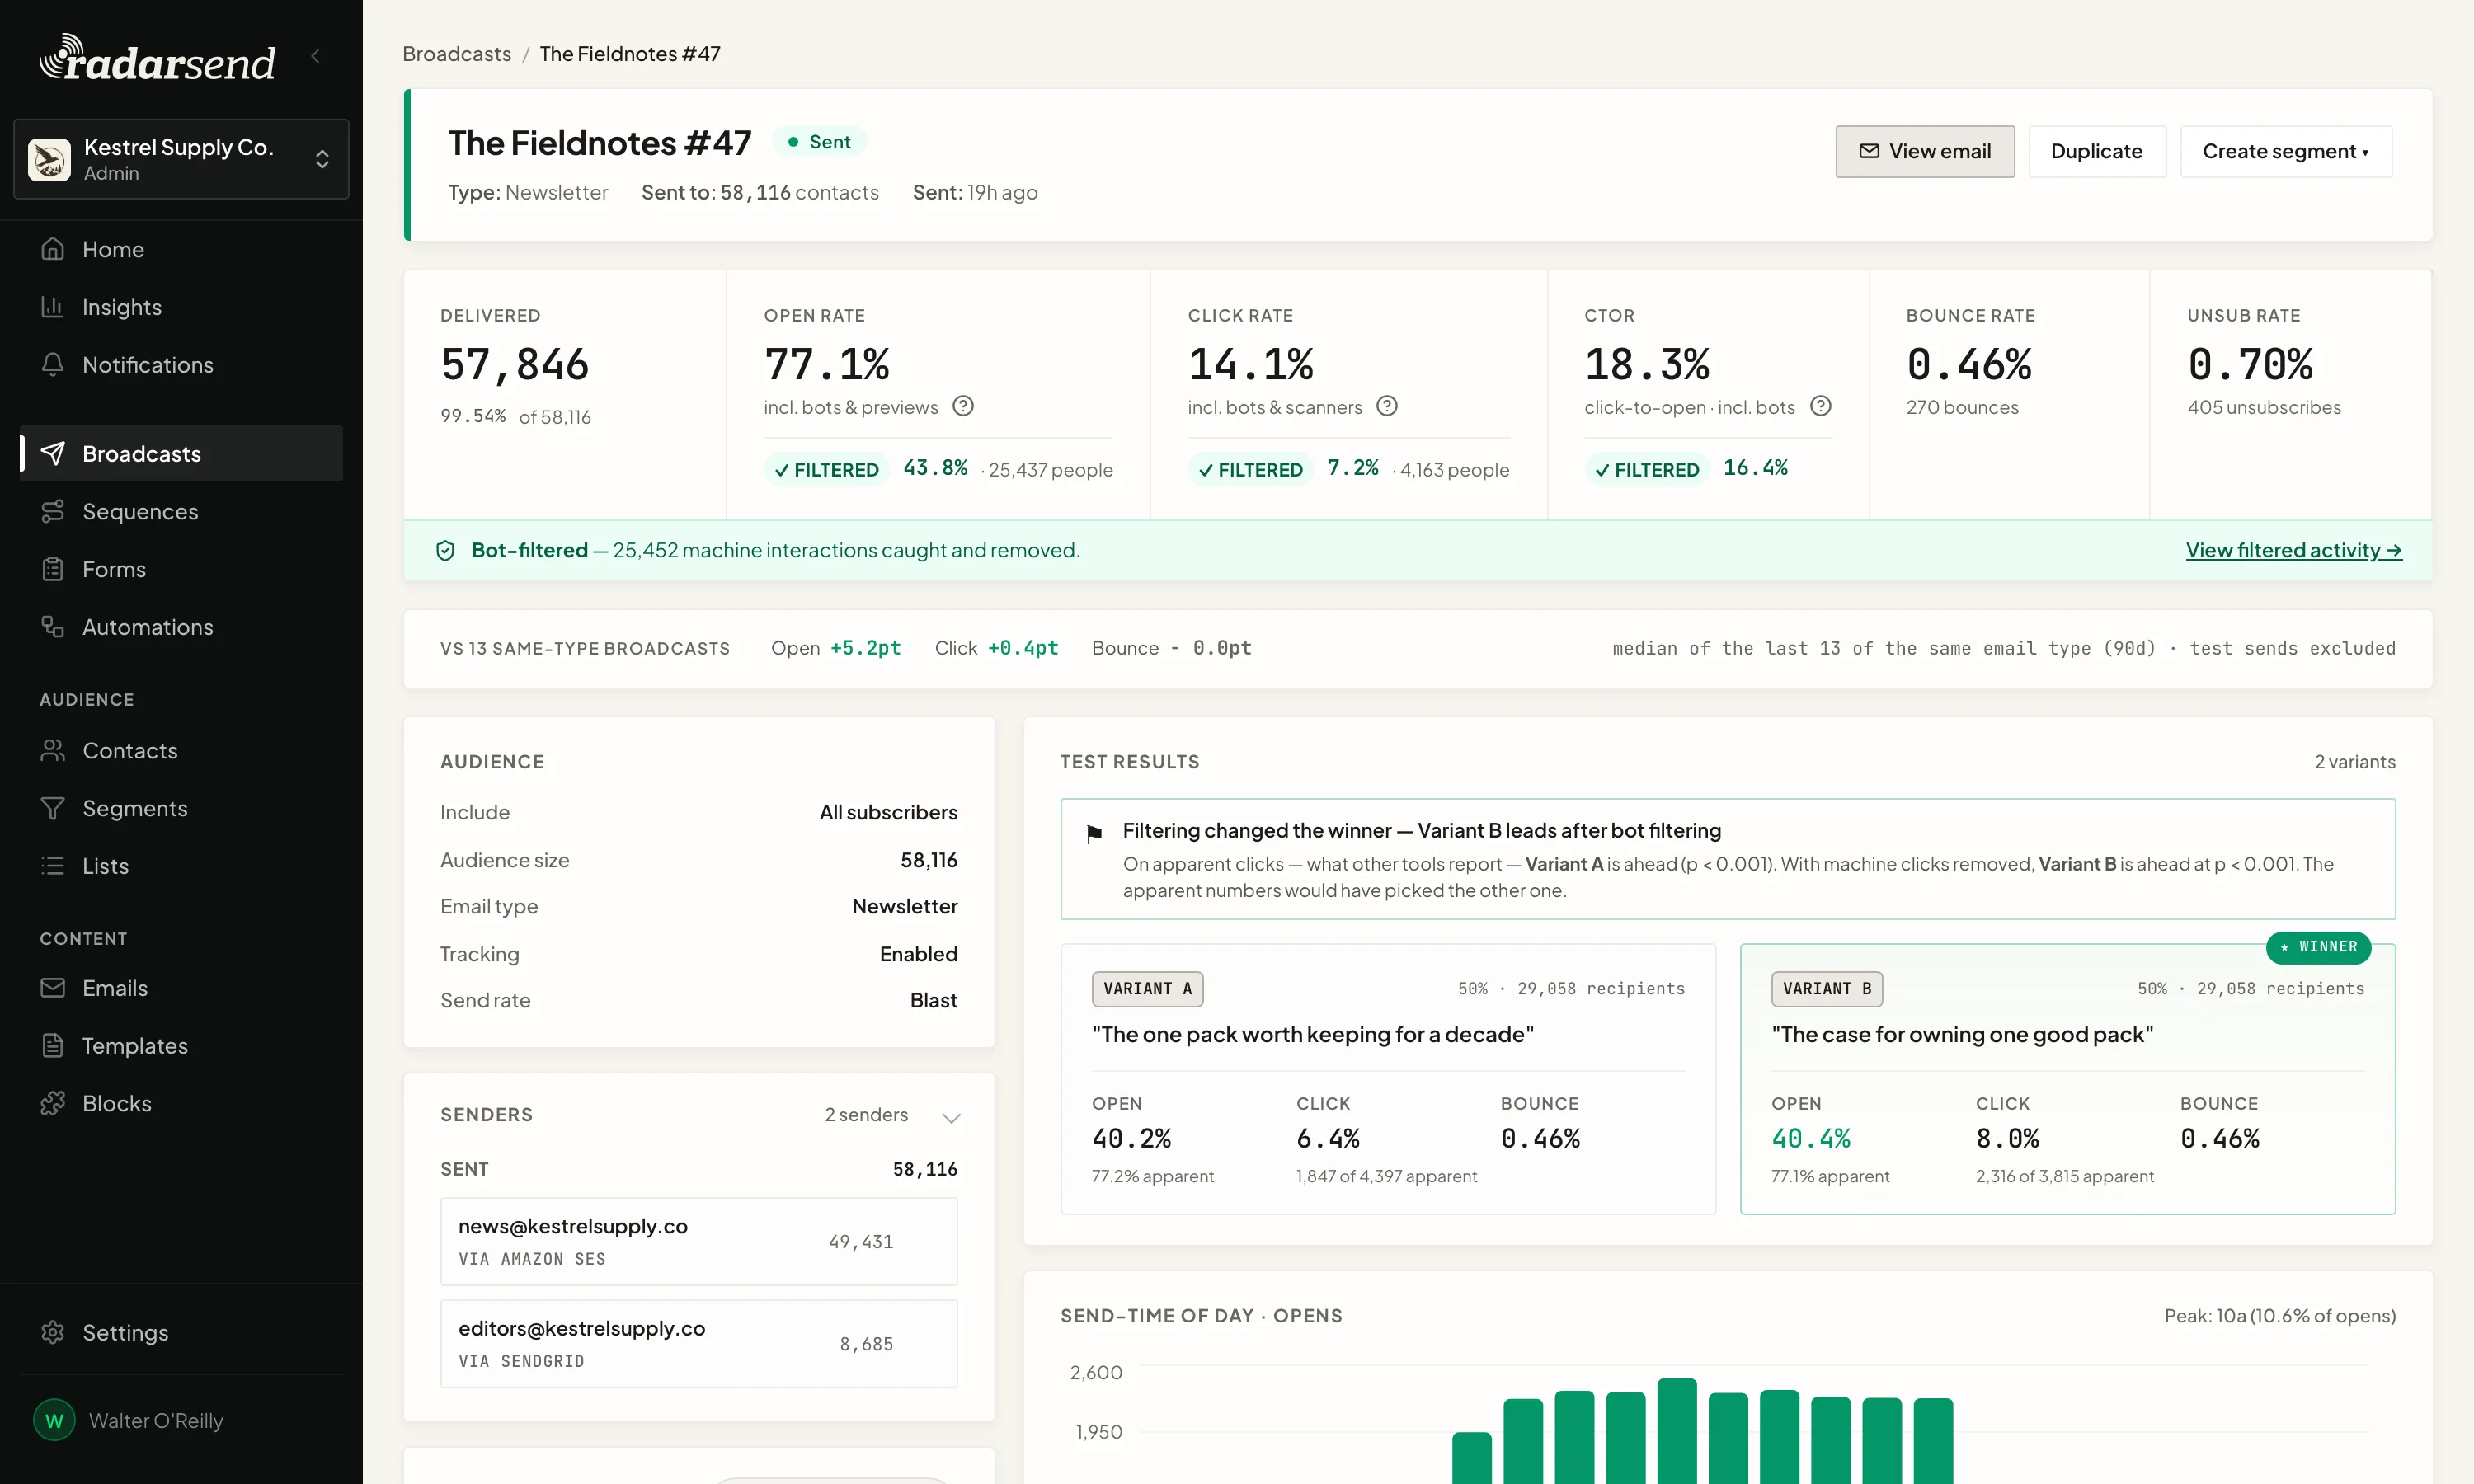
At the top you’ll see the broadcast’s name, its status, the email Type, how many contacts it went to, and when it was sent. View email shows the email as it was sent, with HTML, Text, and Source tabs.
The numbers at the top#
The first row has six tiles. Every rate is out of everyone the broadcast went to, and every count is of people, not events. Someone who opens an email five times counts once.
| Tile | What it shows |
|---|---|
| Delivered | How many emails your sending service delivered, as a share of the audience. It reads Sent while the broadcast is still sending. |
| Open rate | The share of people who opened. |
| Click rate | The share of people who clicked a link. |
| CTOR | Click-to-open rate: people who clicked, out of people who opened. |
| Bounce rate | The share of people whose email bounced, with the number of bounces. |
| Unsub rate | The share of people who unsubscribed, with the number of unsubscribes. |

Apparent and filtered#
Open rate, Click rate, and CTOR each show two figures:
- The big number is the apparent rate. It counts every recorded open or click, including inbox previews, security scanners, and other machines, so it’s comparable to what most email tools report. The line under it says so: incl. bots & previews or incl. bots & scanners.
- ✓ Filtered is the rate with machine activity removed, and how many people that is. This is the number to judge the broadcast by.
A filtered open includes anyone who clicked, since a click proves the email was opened even if the mail app never loaded images. For how RadarSend tells people from machines, see How open & click tracking works.
While activity is being checked#
Scanners and inbox previews hit an email in the first minutes after it arrives, so RadarSend holds new opens and clicks back until it has sorted them. Until then:
- A Verifying engagement card counts down the time left and walks through Delivered, Classifying activity, and Final results.
- Tiles without settled numbers yet show Verifying and Reviewing activity — scanners are being filtered.
- A tile may show how many people are still in review.
This usually takes 20 to 30 minutes after the last email goes out. After that, late opens and clicks keep arriving and are sorted as they come in, so the numbers can still move a little.
Filtered activity#
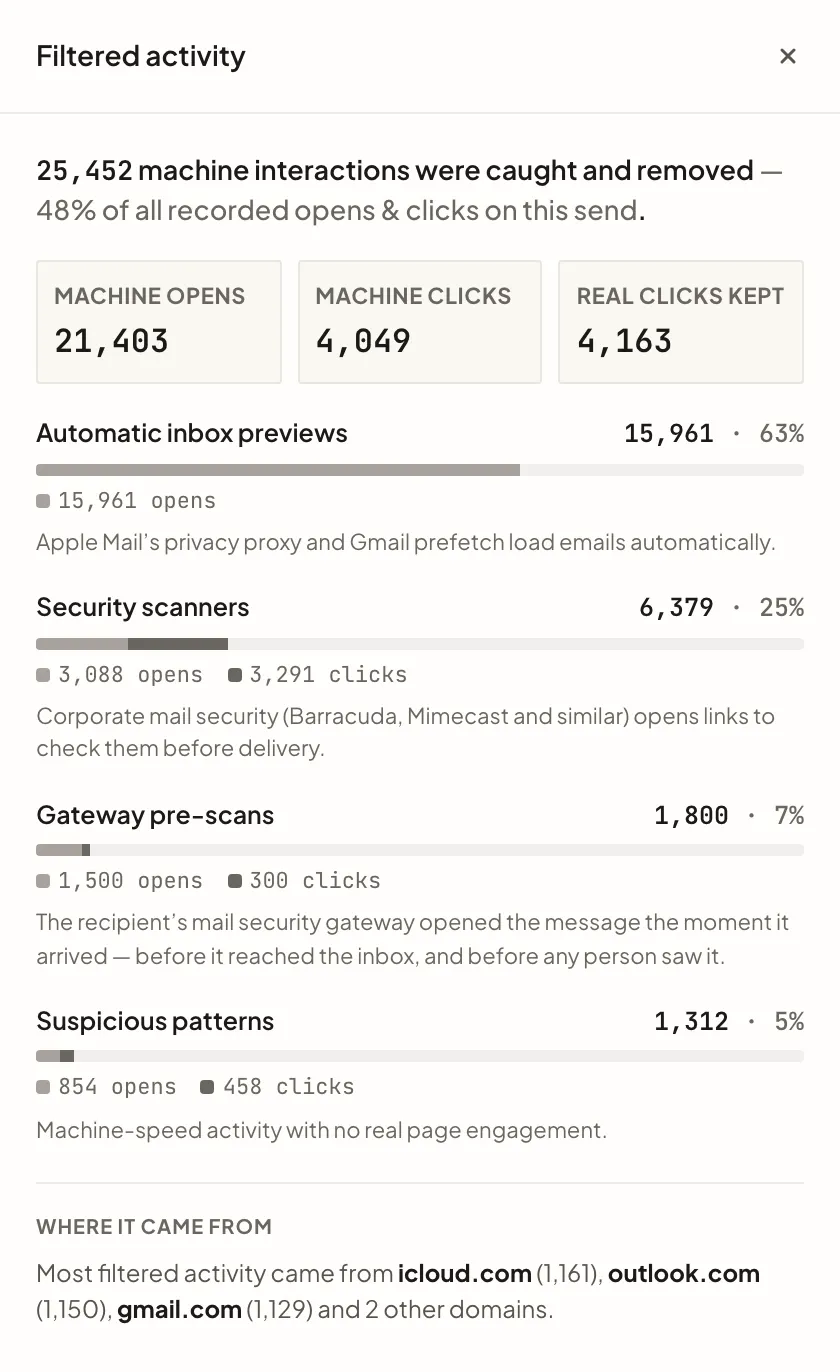
When machine activity was removed, a Bot-filtered line under the tiles says how much. Click View filtered activity → to see what it was:
- Machine opens and Machine clicks removed, and Real clicks kept.
- What caused it: Automatic inbox previews (Apple Mail’s privacy proxy and Gmail prefetching), Security scanners (corporate mail security checking links), Gateway pre-scans (a mail gateway opening the message as it arrived), and Suspicious patterns (machine-speed activity with no real page visit).
- Where it came from — the recipient domains with the most filtered activity.
- Inconclusive — activity RadarSend couldn’t confidently call human or machine. It’s included in your filtered numbers, flagged as lower confidence.
Compared with earlier sends#
Once a broadcast has finished, a strip under the tiles compares its Open, Click, and Bounce rates with the median of your recent broadcasts of the same email type, in percentage points. If there aren’t enough of those, it compares with your last few broadcasts of any type.
Who engaged#
The Top engaged contacts card lists the ten most engaged people, with their Time on site, Pages viewed, Clicks, and Last activity. Time on site and pages come from website tracking, so they’re blank without it.
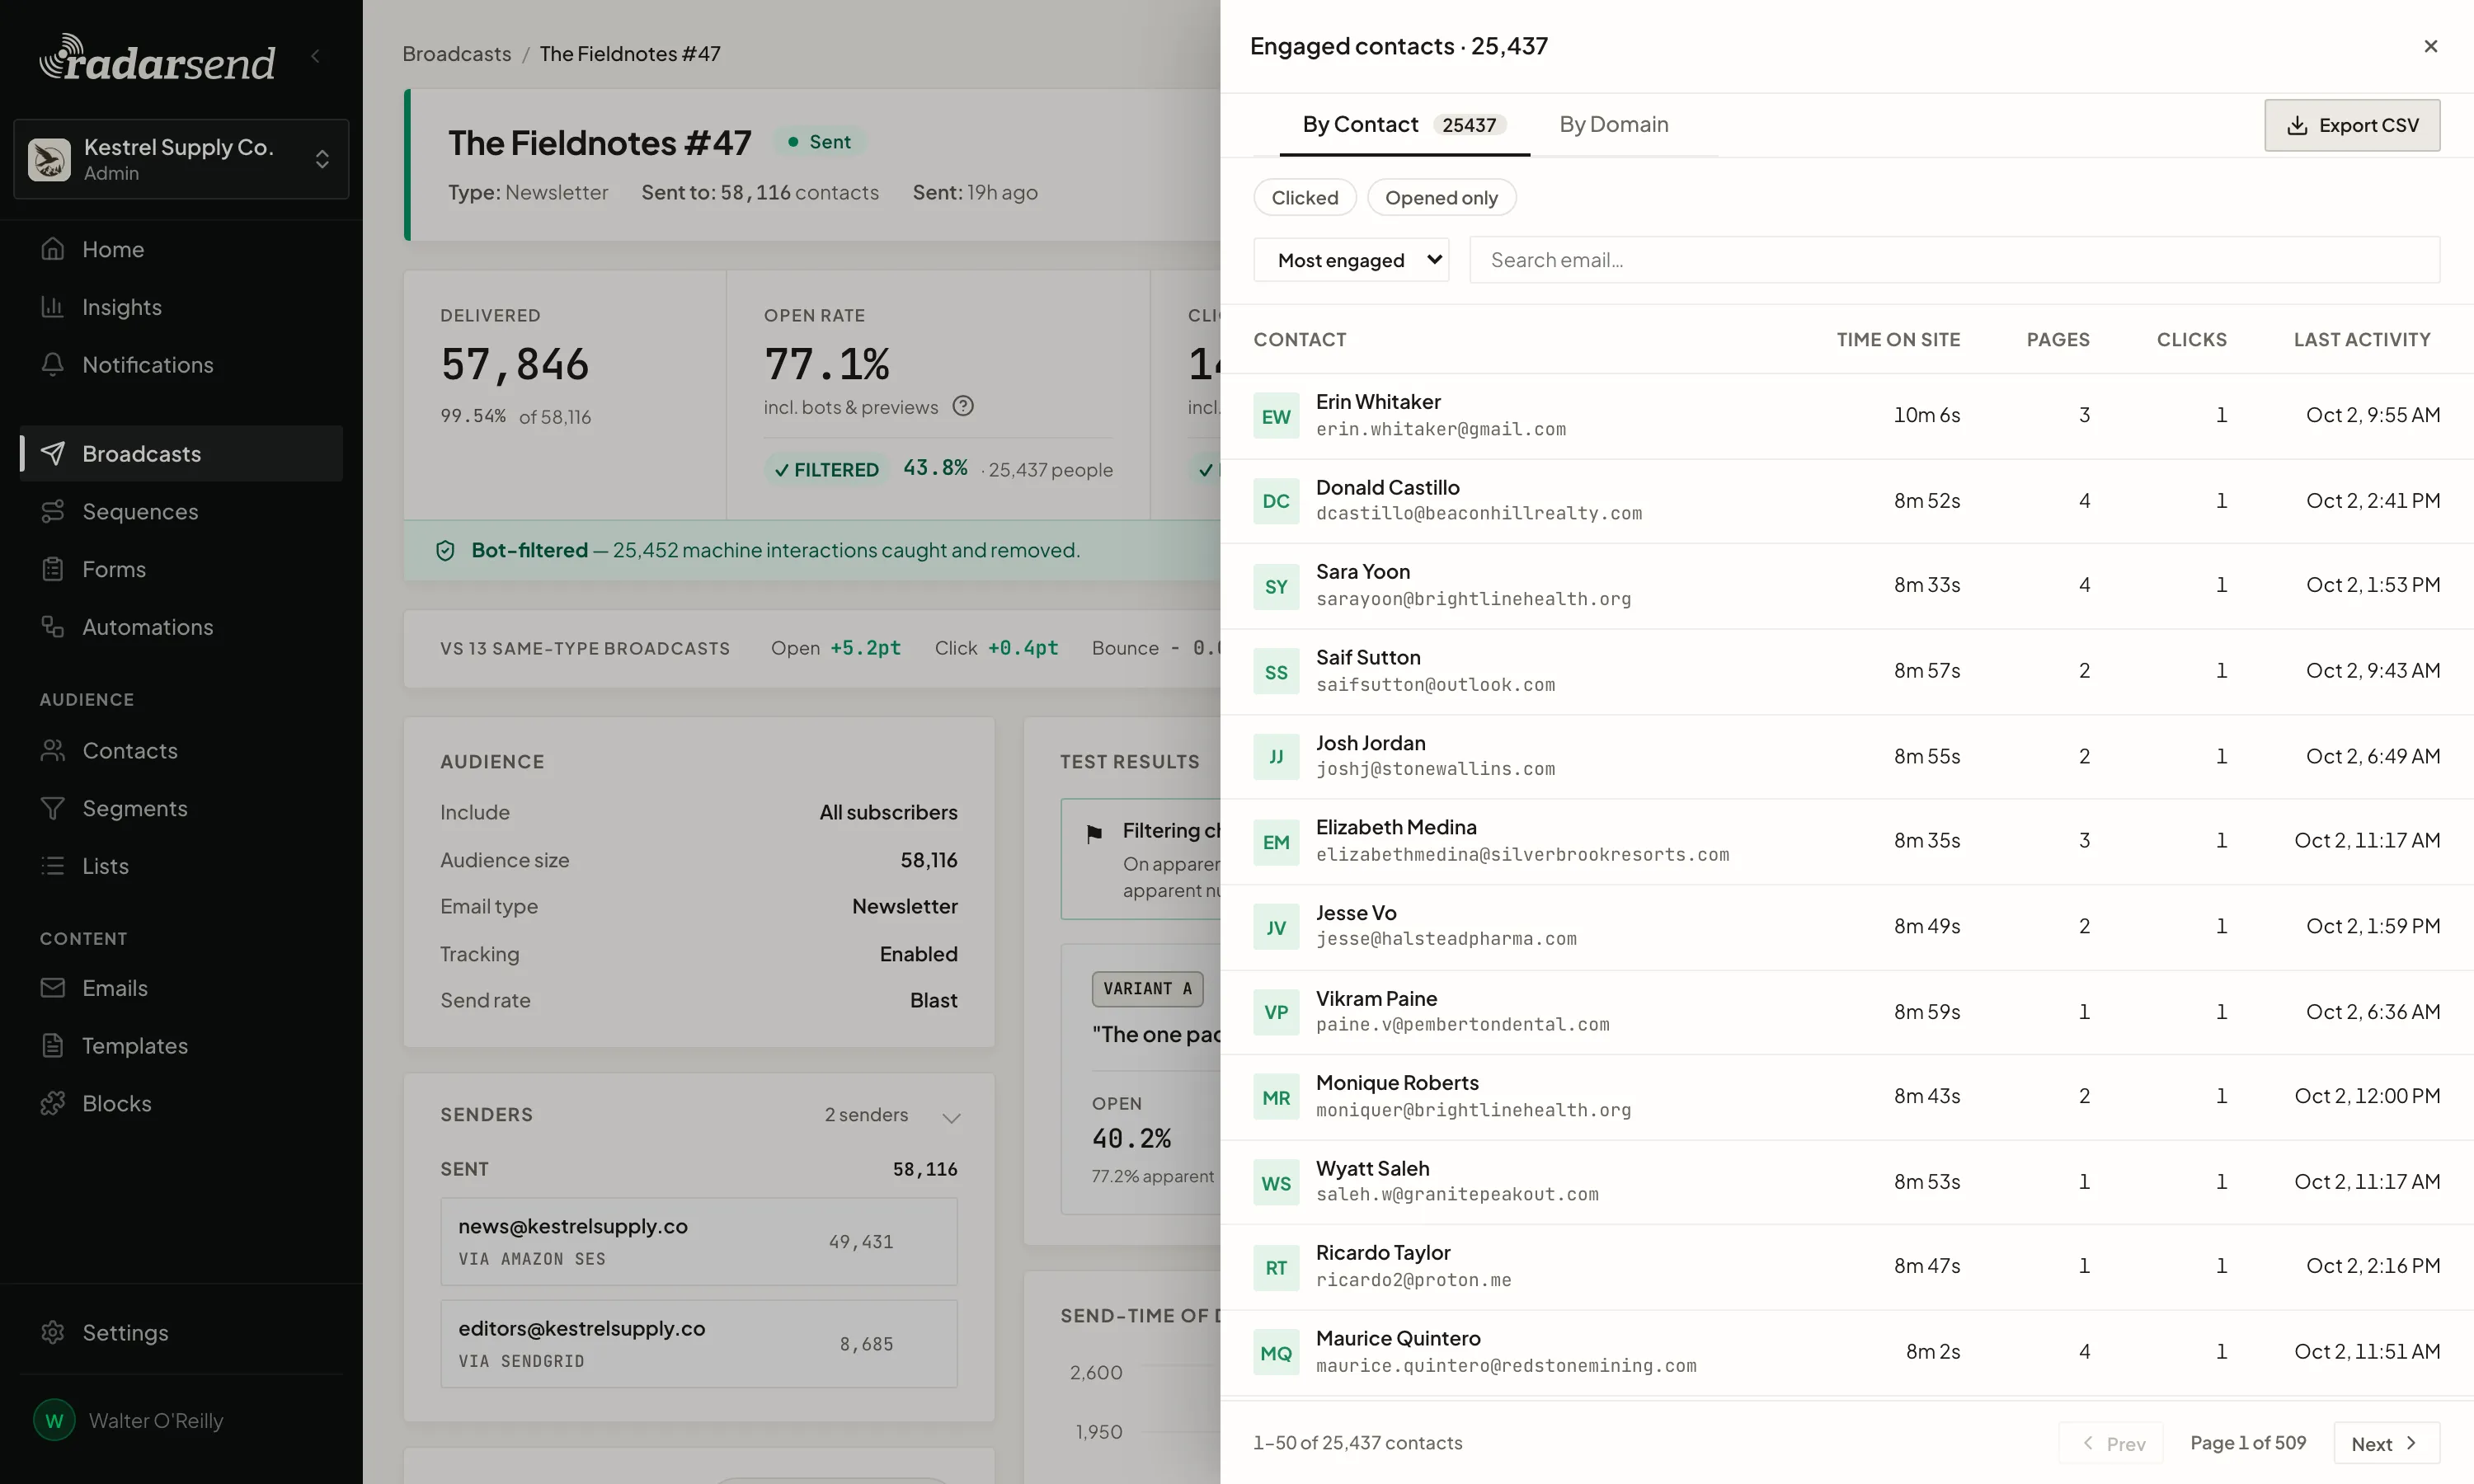
Click View all … → to open Engaged contacts, with everyone who opened or clicked:
- By Contact lists people. Narrow it with Clicked or Opened only, sort by Most engaged, Most clicks, or Most recent, or search by email.
- By Domain groups them by email domain. Click a domain to see its people.
- Export CSV downloads the list as it’s filtered.
To act on engagement, use Create segment at the top of the report. It builds a segment from this broadcast’s Engagers (opened or clicked), Openers, Non-openers, Clickers, Non-clickers, Bouncers, Complainers, or Unsubscribers, or the people who Didn’t receive it, ready for a follow-up.
Links#
Links in email lists each tracked link with how many people clicked it (Unique), how many clicks it got in all (Total), its CTR (unique clickers out of the whole audience), and its share of all clicks (Distribution). Machine clicks are left out. Unsubscribe and preference links are marked system.
The card appears once a link has at least one filtered click. A broadcast sent with link tracking set to Pass-through doesn’t record clicks, so it has no link table.
Timing and audience#
- Engagement timeline — opens and clicks over time, by hour for the first week and by day after that.
- Send-time of day · opens — which hours of the day people opened, in your workspace’s timezone, with the peak hour.
- Audience breakdown — opens by Device or Country, with machines left out.
- Deliverability by provider — for each recipient mailbox provider, such as Gmail or Outlook, how many were delivered, opened, clicked, and bounced, and how it compares with this send’s average. A provider with a lot of machine activity is tagged with its machine share, which usually means link-scanning mail security.
Delivery problems#
- Bounces lists who bounced. Click View all … bounces to open the Bounces drawer. Filter by category, such as Invalid recipient, Mailbox full, or Spam policy, or by Hard or Soft bounce. See each Reason, switch to By Domain to spot a provider that’s rejecting you, and Export CSV. See Bounces and suppression.
- Not delivered lists recipients RadarSend tried to deliver to and couldn’t (Failed), and those it deliberately didn’t send to because they unsubscribed, were suppressed, or had blocked the sending address (Skipped). Each group is sorted by reason.
- Unsubscribes lists who opted out, whether from All emails or one category, and how long after the send.
- Spam complaints lists who marked the email as spam.
Senders#
The Senders card shows how many emails went out from each sender and the sending service it used. If you sent from more than one sender, a Sender split card compares their click rates after filtering. It’s for reference: senders weren’t assigned at random, so it can’t tell you one is better. To test senders fairly, see A/B test a broadcast.
While it’s sending#
While a broadcast is Sending, a strip at the top shows how many have gone out, and Live progress shows Sent, Delivered, and Bounced as they happen. Opens and clicks appear once they’ve been checked.
For a broadcast spread out over several days, the Delivery plan card shows each day’s status and progress, and the status reads, for example, Sending · day 2/5.
From the header you can:
- Pause and Resume the send. The strip says why it’s paused, whether you paused it or RadarSend held it because a sender ran short of capacity.
- Cancel send to stop it. Emails already sent can’t be recalled, and the rest of the audience won’t get it.
A/B tests and seed copies#
- An A/B test gets a Test results card once sending finishes. See A/B test a broadcast.
- If the broadcast also went to a vendor’s seed list, a Seed lists card shows how many of the vendor’s test inboxes got a copy and whether they were all delivered, what those inboxes clicked or visited, and a line per mailbox provider. Show all copies lists each one. Where each copy landed (inbox, spam or another tab) is in your vendor’s own placement report. Seed activity comes from the vendor’s automation, so it’s kept out of every other number on the report and out of your website traffic. Many vendors’ mailboxes don’t load images, so their copies often show clicks but no opens.
- A seed copy that bounces is one of two things. Refused means the provider rejected the mail, which almost always means it’s blocking that sender, so your real contacts there likely saw the same. Address gone means the test inbox no longer exists, and that seed is retired.
- Each seed copy is kept for 90 days. After that, the card still shows the broadcast’s totals and the line per provider, but not the list of copies.
Common issues#
- The filtered open rate is much lower than the apparent one. That’s the machine activity coming out. Apple Mail’s privacy proxy alone can open a large share of emails automatically. View filtered activity → shows what was removed.
- Open and click tiles say Verifying. RadarSend is still sorting early activity. Give it about 20 minutes after sending finishes.
- No clicks at all. Check that link tracking wasn’t set to Pass-through for this broadcast, and that your tracking domain is live. See How open & click tracking works.
- Time on site and Pages are empty. They need website tracking on the pages you link to.
- The status says Sent · … failed. Some recipients couldn’t be sent to. The Not delivered card lists who and why.
- A card I expected is missing. Cards only appear when they have something to show: Links in email needs a click, Bounces needs a bounce, and so on.
Good to know#
- Rates are out of the whole audience, not just delivered emails. A broadcast with many bounces shows lower open and click rates as a result.
- Reports keep updating. Late opens and clicks keep arriving after the send, and each one is checked before it counts.
- Duplicate (on a finished, canceled, or failed broadcast) starts a new draft with the same settings and content.